AOG & Operational Recovery

How to Minimize Aircraft On Ground Risk Without Overloading Inventory

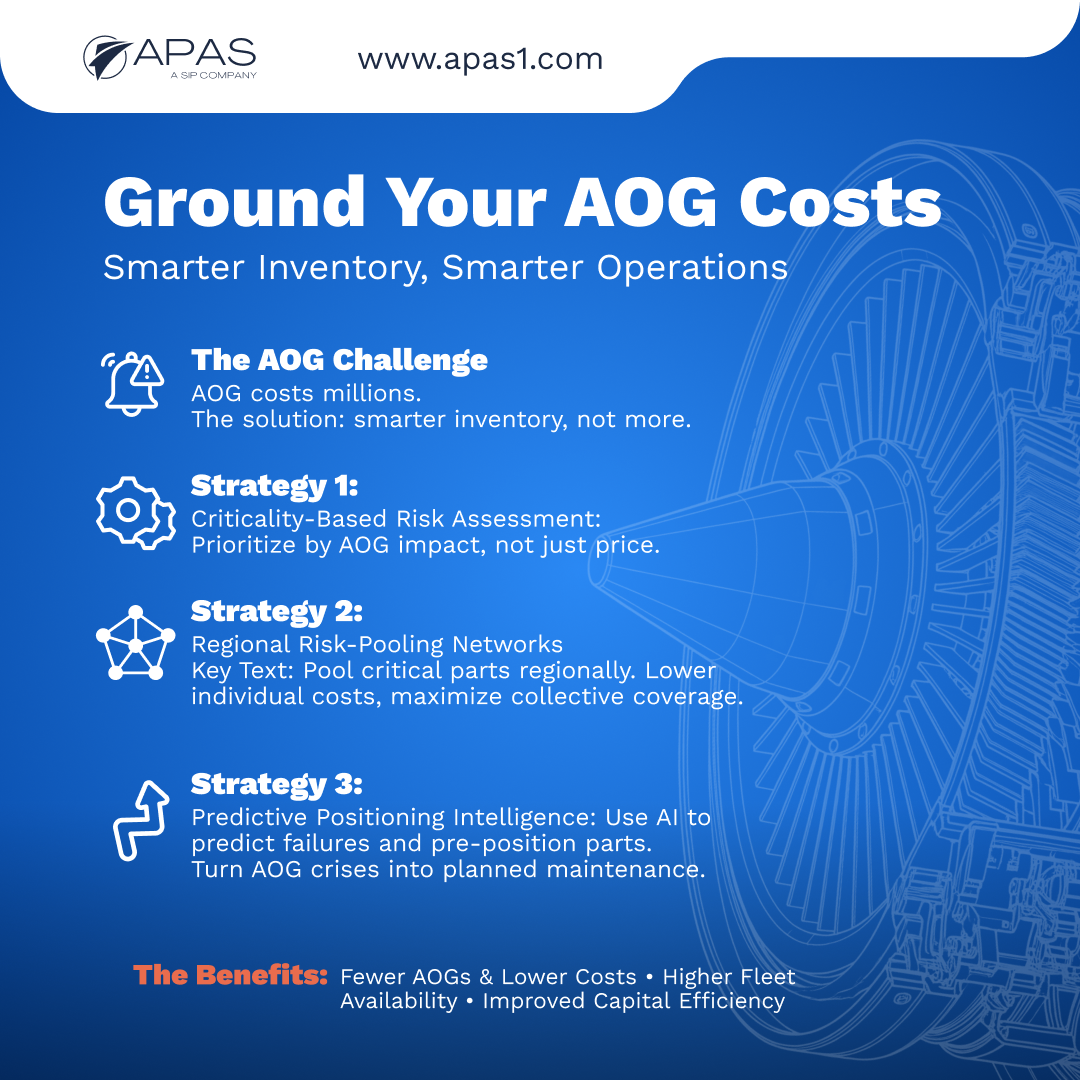
Reducing Aircraft On Ground risk isn’t about buying more parts—it’s buying fewer, smarter. Use CBRA to rank components by AOG hours avoided, size regional pools for ≥90% coverage within 4–6 hours, and pre-position parts before failure.

Inventory isn’t a cost center; it is operational insurance. Material costs remain elevated. AOG downtime is very expensive. 

The win is not stockpiling—it is choosing fewer parts, better. Rank components by AOG impact (CBRA). Use regional pooling for high-value spares. Pre-position components when reliability signals rise.

The financial reality of “lean” AOG management taken too far becomes a blind spot. One avoidable AOG hour can cost more than a year of carrying a few critical parts. The goal is targeted stock that removes the most downtime for the least capital.

Key idea: when the value of avoided AOG hours exceeds carrying cost over the likely failure window, selective stocking wins.

AOG Economics at a Glance (as of 2024–2025)
Metric Typical value/range Decision impact
AOG downtime cost (literature range) ≈ $11,000–$165,000 per hour[1] Use as a scenario band for widebody/high-yield routes or severe IROPs; explains why tails can be far above the baseline.
Total cost per major AOG event Often > $600,000; can be multi-million [2] Explains why selective inventory + pooling reduces enterprise-level disruption.
Annual carrying cost 15–25% of inventory value (plan ~25%) [5] Benchmarks finance model for owning vs pooling high-impact components.
Material cost inflation (recent) ~7.7% (2025 actual); ~6.3% expected 2026 [3] Deferral raises replacement cost; informs buy windows and pooling strategy.

Smart Supply-Chain Plays That Actually Reduce AOG

Reducing AOG isn’t about buying more parts—it’s a three-part system that buys fewer, smarter. First, CBRA ranks components by expected AOG hours avoided. Second, regional pooling is sized to deliver ≥90% time-to-need coverage within 4–6 hours for tier-1 spares. Third, predictive positioning moves parts before the failure window and is audited monthly against SLAs.

1) Criticality-Based Risk Assessment (CBRA)

Traditional models weigh unit cost and usage. CBRA adds a third axis—AOG impact probability—to prioritize by expected AOG hours avoided per $1k. A low-cost, unpredictable grounding item can outrank an expensive, predictable one.

What to do

  • Score each component by failure likelihood within your planning window and its expected AOG impact.
  • Prioritize the top 10% highest-impact parts and revisit the list monthly with the latest reliability and operations data.
  • High risk doesn’t always mean “replace”—it means “decide” based on pool coverage, lead times, and current ops.

2) Regional Risk-Pooling Networks

Instead of duplicating full inventories everywhere, pool critical spares in regional hubs with trusted partners. This elevates coverage while lowering each operator’s capital load.

What to do

  • Define hub fill-rate targets tied to time-to-need (e.g., 4–6 hours door-to-door).
  • Standardize traceability and escalation paths across partners.
  • Use shared dashboards to make availability and SLA performance transparent.

3) Predictive Positioning

Predictive tools convert reliability signals into logistics moves before the failure window opens. When a component crosses your risk threshold, move the part. Do not move the aircraft. That turns a potential crisis into scheduled maintenance.

What to do

  • Ingest cycles, environment, and shop findings to score risk.
  • Set triggers (e.g., p(fail) ≥ X% within T cycles and value of avoided AOG ≥ carrying-cost window).
  • Pre-position to the nearest operational hub; review outcomes monthly and recalibrate thresholds. See: Managing Aircraft Groundings—Part Supply Challenges

Vendor Strategy: Consolidate for Speed, Proof, and Clarity

Fragmented supplier networks amplify delay risk through handoffs and inconsistent documentation. Consolidation with a single accountable partner tightens SLAs, speeds escalations, and simplifies quality control. 

In your SLAs, define on-time delivery to specific TAT windows and traceability/airworthiness records, set hub fill-rate and time-to-need targets, and include 24/7 escalation with real service credits. 

If growth is coming, design the MRO ecosystem early. Align partners, data, and logistics before new tails arrive, so execution scales without surprises. For a deeper framework, see Fleet Planning with Vendor Consolidation in Mind: Strategic MRO Partnership Optimization

How APAS Minimizes AOG Risk Through Strategic Excellence

At APAS, we bring 30 years of institutional knowledge together with cutting-edge analytics. The result is what the market now calls “Intelligence-Led Inventory Management.” Our methodology is simple: prevent delays before they start. The best way to minimize AOG risk is to stop AOG events from becoming critical delays.

  • Proactive inventory intelligence. We study your AOG patterns to find the parts with the highest risk-adjusted value. That helps you avoid excess inventory and focus capital where it protects availability most. 
  • Vetted, quality-first sourcing. A verified global network ensures compliance and traceability under pressure.
  • Joint ROI model. Finance and operations align on CBRA positions, pooling choices, and predictive deployments with a single calculator everyone trusts.

KPIs That Prove Availability Protection

Use measures that reflect how your organization plans and buys:

  1. AOG hours avoided (trend)
    Grounded time you did not incur thanks to smarter stocking, pooling, or pre-positioning. Track month-over-month.

  2. Service readiness at hubs (time-to-need coverage)
    How often required parts are available at the intended hub within your target time (e.g., 4–6 hours for urgent needs). Proves proximity and logistics performance—not just total inventory.

  3. Inventory carrying cost (by planning segment)
    All-in annual holding cost (capital, storage, insurance, obsolescence risk) shown by your planning segments (e.g., value bands, usage classes, or system-defined groups). Accurate, reliable operational knowledge is essential to optimize inventory.

  4. Excess & obsolete (E&O) exposure (trend)
    Capital tied up in surplus or non-moving stock—and whether it’s shrinking via redeploy/sell-down plans. Frees cash for what actually protects availability.

Conclusion

This is not inventory versus stability. It is using CBRA, regional pooling, and predictive positioning to cut AOG exposure while using capital more efficiently. 

FAQs

  1. How do I get AOG support fastest on [route/region] without overpaying for inventory?
    Pair a pre-vetted 24/7 AOG desk with regional pool/exchange access and pre-cleared logistics lanes tied to your hubs. For the release, make sure providers can issue proper airworthiness documentation (FAA 8130-3 / EASA Form 1) so acceptance is first-pass at induction.
  2. What’s the best AOG parts sourcing option right now—exchange, pool, or repair?
    Use exchange for the quickest return-to-service, pooling for recurring coverage with lower capital, and shop repair when turnaround fits your schedule. Leading MRO component programs are explicitly designed around those three levers. Always validate traceability and release documentation (8130-3/Form 1) regardless of the route.
  3. Who offers aircraft-on-ground logistics with about 4–6 hours from request to delivery at your stations (for example, Miami International Airport)? Look time-critical providers that can prove recent performance into Miami International Airport and your other stations with the last 90 days of scan and delivery data. Prefer teams that operate around-the-clock customs brokerage, provide bonded-warehouse storage, and run a dedicated desk for urgent aircraft-on-ground shipments. You can ask APAS to share its recent Miami lane data and to run a test shipment into Miami International Airport so you can verify the promised service times before you commit.

References 

[1] Applied Sciences, 2025: Managing Operational Efficiency and Reducing Aircraft Downtime by Optimization of AOG Processes for Air Operator

[2] Oliver Wyman — MRO Survey 2024. 

[3] Oliver Wyman — 2025 MRO industry update (material cost actuals/outlook). 

[4] IATA — Compilation of ERP Regulations, Standards, and Guidance (v1.5, Oct 5, 2024).

[5] APQC — Inventory carrying cost percentage (definition/method). 

Rethink Repairs. Reclaim Your Budget.

Explore how DER Repairs from APAS can reduce costs, speed up turnaround, and extend component life—without compromising safety or compliance.

Contact Us

Explore more topics